07 December 2009

Grand Opening at Game Universe

For my Milwaukee are reader, Game Universe is opening up a new location in Brookfield., and celebrating with a Grand Opening Party.


Game Universe

Board Games, RPGs, Dice, Minis, & Magic the Gathering
SOUTH: 4631 S. 108th St. - Greenfield, WI 53228
WEST: 19035 W. Bluemound - Brookfield, WI 53045 (map)

Our favorite Catalyst Demo Agent will be running a Battletech Demo if space allows.
GBR Giant Battling Robots Favicon

02 December 2009

My life is complete: Mario performs 'Don't Stop Me Now'

Strange and annoying, but somehow compelling. Click thru for the video.

My life is complete: Mario performs 'Don't Stop Me Now':

Is there a term to describe those Super Mario World levels that play themselves and sometimes make music as a result? I'm sure there is, but I don't know it. 'Automatic Mario' doesn't count, because that sounds silly. At any rate, you surely know what I'm referring to.

The good folks at GoNintendo have stumbled upon what has to be the greatest of them all -- it's Queen's 'Don't Stop Me Now' as played by four different Mario levels running simultaneously. The more I type, the longer it will take for you to watch it, so I'm going to cease talking.

Gotta love Freddie and the boys tho.

28 November 2009

Engine 371

No robots today - This is a short film - Engine 371 by Kevin Langdale about (stay with me here) the Canadian Transcontinental Railroad. It's also a model railroader's dream come to life, and illustratse how model railroad enthusiasts see their creations.


Battletech players Gamers are the same way about their miniatures and the game worlds they come from. The imagination lets it come alive and surpass the borders of the table top.

More images of the 2007 Camospecs diorama on my p-bucket albums. Blame Steven Satak for the incredible Union dropship model.

GBR Giant Battling Robots Favicon

05 November 2009

A few hours in the library

As the saying goes among those engaged in research, "A few hours in the library can save you a few months in the laboratory". (The order is sometimes switched to turn this into a joke, "A few months in the laboratory can save you a few hours in the library".). In my case, a few minutes with Google may save me a few months of banging on a spreadsheet program or R program trying to puzzle out some difficult mathematics. Earlier today I made an interesting find:
[subscription access required for the article, otherwise you just see the abstract.]

This is a recent article that describes a mathematical model closely related to something I'm trying to work out for Battletech. The probability distribution that describes how long a Battlemech will survive during play is very complex, which is no surprise, but then I discovered I was still underestimating the problem. The article above describes a type of situation similar to what occurs in Battletech, and demonstrates a nice matrix based approach to formulating the problem.

The "phase" in Phase-Type distribution refers to the particular state of the system. In Battletech terms, the starting phase would be an undamaged mech, the end phase (absorbing state) would be the head, center torso, or engine destruction, and the phases in between would represent various states of destruction in between. The diagram below (borrowed from the PhD Thesis: Aggregate Matrix-analytic Techniques and their Applications of Alma Riska, PhD), shows an example. Here the undamaged starting "phase 0" would be state "0,0" on the left, phase 1 would be any single (non-fatal) section destroyed) such as either arm destroyed (not both), which might correspond to the "0,1" and "0,2" states. Phase 2 would be any legal combination of two destroyed locations, 3 for phase 3, and so on.


The arrows connecting the states represent the probability of moving from one state to another The whole thing can be written as a matrix giving the probability of moving from one state to another at a given time. Battletech has at least 150 states, and a complex interconnections. It's complicated, but now I know it can be done, and I have a new line of study to help me figure out how to do it.

That problem is on the back burner for a while though. I am presently working on something simpler that might have more immediate and practical application. Work and home have been very busy, so progress is slow. Soon, I hope.
GBR Giant Battling Robots Favicon

27 October 2009

Pilgrimage To Mecha

[From The Escapist magazine]
Make no mistake: Gundam is a big deal in Japan. To put it in context for a Western audience, Gundam is the Japanese equivalent of Star Wars, complete with an iconic masked antagonist, laser swords and modern installments of dubious quality. But that comparison doesn't explain the presence of a 60-foot statue that took over two months and millions of dollars to complete.

What's so special about Gundam, anyway?


How about a quick unscheduled trip to Japan to explore their love of all robots, giant and battling?


I missed out of the Gundam shows as a kid, but somehow I still managed to find and read the first three Robotech book series. As bad as those books were, they still managed to capture my imagination.
In Japan it seems to have capture the whole country.


When I discovered Battletech through various computer games, I actually started having Battletech dreams on a regular basis. Weird? Maybe. It seemed to allow me to play out a sort of superman fantasy. I don't see myself as any sort of superman, but that particular sort of escapist fantasy does seem to be very popular.

But enough of my ramblings. Go read John Funk's Pilgrimage to Mecha for yourself.

GBR Giant Battling Robots Favicon

26 October 2009

What Next?

I'm kicking around some ideas of what to write about next, and I thought I might ask my readers what seems interesting. Here is a partial list:

  1. Stochastic Duels: This series is stalled, but not forgotten. This will get done eventually because it is part of my "master plan". 
  2. Fair Dice. There was a spurt of interest in this following Kit's post at the Scrapyard Armory, but I had some other ideas I still want to follow up on. These include measuring a set of dice to see how regular the casting is (I found my calipers!), and some more mathematical results about fair dice I could describe.
  3. A series on basic strategic choice in war games, tentatively titled "Toy Soldiers". And by basic I mean starting with the most trivial situation possible and working up to some common choices in games.
  4. A better Battle Value for Battletech. I've been working up to this one for a long while, and I still don't have all the pieces I need to do this right. However, doing it wrong might still be interesting. What I have in minds would also be applicable to a lot of other games too. This would be even better if I could do a little programming work to calculate the value first.
  5. Painting Miniatures, which would require me to get off my butt and start painting!
  6. There is no idea #6.
  7. Designing Games: I simply ran out of time for the Game Design Concepts class over the summer, but I'd like to get back to it at my own speed. I have a growing list of game ideas, and with a little effort, any of these might be fair material for posts.
  8. Lanchester's Laws, something else I keep threatening to write about, also part of my master plan. Hmmm ...
  9. I read this post about Chaos theory, and it made me wonder if that might be worked into a game somehow.
  10. I've got a stack of old notes I started writing before I was blogging too. I should scan through those for more ideas.

That's enough. Suggestions and requests are always welcome.
GBR Giant Battling Robots Favicon

24 October 2009

2009 Chicago Golden Demon Winners

Perfect timing! Just when I was needing some inspiration to get back to my painting, the 2009 Chicago Golden Demon Winners are announced.

[Note: This link may redirect you to the Games Workshop front page instead of taking to to the pictures. If this happens, select your language, and it should take you to the Golden Demon article. If that fails too, come back here and try the link again. - D]


I don't play Warhammer, but I do appreciate the work that goes into these miniatures. Some of these are simply fantastic.


I made my copies of these image small and low-quality. Consider that a suggestion to go see all the originals from Games Workshop.

UPDATE2012: The old links no longer function as intended, wither broken or redirected. Try this: http://www.games-workshop.com/gws/content/article.jsp?aId=13000009a
If you are redirected to the GDW front page, use the drop-down there to identify your country/language, then try this link again.
GBR Giant Battling Robots Favicon

23 October 2009

Games and Reality are Probably Different, Part 4

In the previous posts in this series (1 2 3) I have been describing the probability distributions generated by dice and trying to describe why that doesn't quite match what we experience in reality. Not all games have dice though; some games use physics to simulate the real world, and the only random element might be the actions of the player themselves. Do these games suffer the same problem? - I think they do - but first, I need to tell you about my favorite TV show.

My favorite TV show - Top Gear on BBC television - is a mix of fast cars, testosterone, and the best of British absurdest humor humour. The show is co-hosted by Jeremy Clarkson, BBC television host and professional overgrown child. I can call him that because I am horribly jealous of his job, which seems to consist entirely of driving fast cars and making snarky comments. Here is his mini biography:
Jeremy has often been described as 'the most influential man in motoring journalism', mainly by himself. Estimates suggest that he is slightly over nine feet tall, owns 14,000 pairs of jeans and has destroyed almost 4.2 million tyres in his lifetime. He is best known for possessing a right foot apparently consisting of some sort of lead-based substance, for creating some of the most tortured similes ever committed to television, and for leaving the world's longest pauses between two parts... of the same sentence. He has never taken public transport.
In a recent (recent to me) segment of the show Jeremy takes on "The Corkscrew" at Laguna Seca, perhaps the most difficult corner of any race track in the world. First Jeremy first practices with Gran Turismo 4 to get a good track time, and then tries the same track in real life. (What is there about his job not to be jealous of?) See how well he does:


[The video is broken, but try one of these links:
http://videosift.com/video/Top-Gear-Real-life-racing-vs-Gran-Turismo
http://en.wikipedia.org/wiki/Mazda_Raceway_Laguna_Seca#Automotive
http://www.streetfire.net/video/top-gear-nsx-laguna-seca_208766.htm
http://www.kewego.com/video/iLyROoaft0ZG.html]

The Gran Turismo games are great simulations, but they miss some of the little things that make race driving harder. While there is no random dice rolling to this game or to driving a car (1), the limitations of human reactions add an element of uncertainty and randomness. Most of the time that random aspect is too small to notice, but when it comes to doing something really hard those little things start to matter. The Game is no longer a good representation of the Reality. One of the things Jeremy points out is that a game can't make you afraid of spinning off the track, and so fear adds another layer of difficulty in the real car.

That's OK, it's supposed to be a game. If every player had to learn all the skills of a real race driver it wouldn't be much fun. As pointed out in the comments to Part 1 of this series, games don't need to have a perfect representation to give players a challenging task and tough decisions to make.


Footnotes:
  1. If you want to get picky, then for practical purposes it's not possible to measure or simulate every last detail, and this error could well be described as "random".
Related Post: Physics of Racing, and Gran Turismo 2.
GBR Giant Battling Robots Favicon

22 October 2009

'Tis Better to Give than Receive

Forwarding some news from my friends at MechCorps. (previous posts 1 2 3)

For Immediate Release:

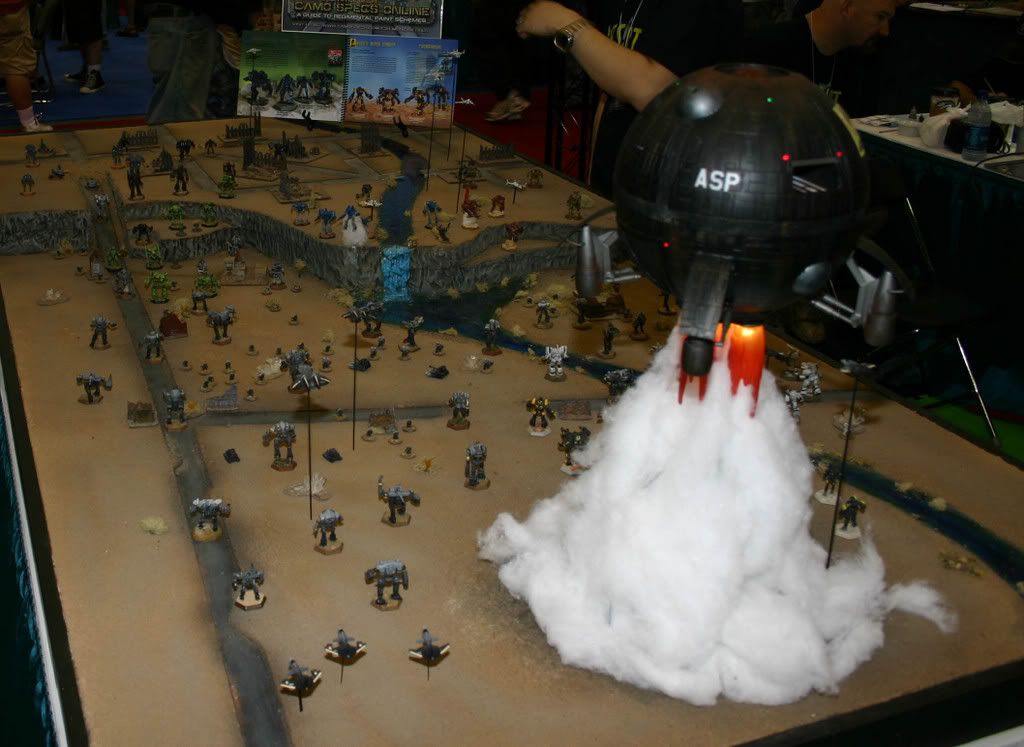
From the convention away missions with MechCorps' Mobile Armor Division [www.MechCorps.com/concal], there is developing a strong BattleTech contingency in the land of Acadiana, otherwise known as Louisiana. The various lances in this region have asked for an event for which they can collectively attend at our Headquarters in Houston, TX and prove their piloting skills in the Virtual World, Tesla II BattleTech Pods.

MechCorps would hereby like to invite all 'Mech pilots receiving this message to the gathering on December 11 and 12, 2009. It is a low-key event that will allow for a selection of entertaining missions for New Recruits up to hearty competition for BattleTech Masters.

Details on this regional event can be found at www.MechCorps.com/GIVEit

For those who have not yet experienced the BattleTech Cockpit Simulator Pods,
the Tesla II cockpits, featuring the BattleTech: Firestorm software, are fully enclosed military style simulators that feature 7 screens, over 90 control systems, and a 12 speaker surround sound system. When seated in the pod, the player pilots one of a selection of BattleMechs onto one of 25 landscapes to compete for battlefield superiority with those seated in surrounding cockpits.

MechCorps Entertainment, LLC is the largest independent operator of Virtual World Entertainment's Tesla II  BattleTech: Firestorm Cockpit Simulator Pods with it's main base of operation in Houston, Texas.  MechCorps' Mobile Armor Division is the touring branch of MechCorps traveling to various conventions and other remote deployments across the United States.  MechCorps Entertainment, LLC is a privately held company. Visit www.MechCorps.com for more information.

Headquartered in Kalamazoo, Virtual World Entertainment is a leading supplier of high-end, centerpiece attractions to the location-based entertainment industry. Virtual World has produced and distributed cockpits since 1989. Virtual World Entertainment, LLC is a privately held company. Visit today at www.virtualworld.com.

This is a private company, but I don't mind promoting them because I think it can only help to foster enthusiasm for Battletech in general. In turn it brings a lot of traffic to my blog. Win-Win.
If you get a chance to try these pods, it can be some serious fun. I'm hoping they will be at ORIGINS again next year. Click through for a map of the Battletech Pods nearest youGBR Giant Battling Robots Favicon

20 October 2009

Carrots and Sticks

Games are increasingly being used to investigate social behavior. Here is an excellent example of an experiment in the form of a game that shows how rewards are better at persuading people than punishment.

Carrots trump sticks
for fostering cooperation

When it comes to encouraging people to work together for the greater good, carrots work better than sticks. That's the message from a new study showing that rewarding people for good behaviour is better at promoting cooperation than punishing them for offenses.
See the full article at Not Exactly Rocket Science.   GBR Giant Battling Robots Favicon

19 October 2009

Games and Reality are Probably Different, Part 3

In Part 2 I did not give an adequate explanation of what I was showing, so I want to go over some of this again more carefully. I also want to re-visit my original question: If additive and proportional representations of probability are so different, and game are representing probability inaccurately, why don't we notice?

I also need to dig myself out of a bit of trouble, because I have been confusing two separate issues. The first is the proportional representation of probability, the second is the how to represent difficulty on a meaningful scale, which I am saying should also be proportional.

First the probability: The probability issue is clearly defined. On the additive side the Uniform distribution is the ultimate example. It has a limited range and you can get from probability zero to one in a finite series of steps (but not infinitely small steps!). When we make a graph of the cumulative probability the uniform distribution forms a straight line.

On the proportional side the best example is the logistic distribution, which I had intentionally left out for simplicity. It has an infinite range (negative to positive infinity), but when you go left or right on the scale you never quite get to probability zero or one (though it may be arbitrarily close). When we graph odds on the logarithmic scale (Log Odds, or "LO") they form a straight line. I have redone my graphs from Part 2 to include the logistic distribution. You can see that the logistic PDF looks very different from all the others, but in the CDF and Log-Odds charts it looks very much like the Laplace distribution. This is perhaps deceptive, because the logistic distribution has very heavy tails. (Click to see a larger image).
There is an additional issue here because there is no obvious reference probability; 0 and 1 are good reference probabilities for the uniform, but that doesn't work for distribution with an infinite range. I have arbitrarily chosen 0.5 as the reference probability for these graphs, which occurs at Z=0.

It will help to have an example to think through this; imagine that you have a set of dice that will generate random numbers from each of these distributions. For the uniform and triangular (2d6, 2d10, 2dX) this is very familiar; any single die is uniform, and any pair of dice is a triangular distribution. For the normal, Laplace, and Logistic distributions we need to imagine we have some "magic dice" that will do what we need. These would be very unusual dice indeed, but it is helpful to compare them to the behavior of 2dX dice we know. The Normal distribution dice will be most like the 2dX dice. The Laplace dice will tend to roll very close to the average most of the time, but will occasionally roll very high or very low. The Logistic dice will tend to roll farther away from the average more than any other dice, and will generate a relatively more extremely high or low rolls.

Now the difficulty: The X-axis on the charts is standardized to a common scale of difficulty, the Z of the standard normal distribution. Think of your dice again, and imagine you are rolling with a "+1" modifier (-1 if you like). On the Z-scale a "+1" standard deviation, or one common unit of variability, is the same for all of these dice.

One more graph - This is the same zoom-in chart from Part 2, but I have annotated it for discussion (except no logistic distribution here). Between log-odds of -1 to +1 is about 45% of the total probability of all these distributions. That means nearly half of the rolls of your dice will be within this range. Within this limited range the cumulative probabilities for these distributions are very similar. The uniform and Laplace distribution are practically on top on each other here, though the shape of these two distribution (see PDF chart) could hardly be more different (The logistic distribution would be very close to these). Likewise for the 2dX and normal distributions; these are barely distinguishable within this range. Although these distributions might be very fact different, the differences in the cumulative probabilities only matter at the high and low ends, not in the middle.


It has been a long haul, but I can finally (FINALLY!) start discussing why I think we don't notice the difference between additive and proportional probability.
  1. As I demonstrated above, for the middle range of difficulty there isn't much difference in the cumulative probabilities, and one distribution might do about as well as any other. Games tend to emphasize tasks of medium difficulty because they are interesting - It's not much fun to play a game where you are trying to do something that is practically impossible or incredibly easy. On one hand hundreds of rolls might be needed to succeed, and on the other success is not a challenge. Good games avoid this by keeping difficulty in the the middle where the chance of success or failure is interesting.
  2. In games it is common for the dice rolls for success to be identical in similar situations. This is not the case in reality; In the real world things are constantly changing, and many tasks are never exactly the same twice. It seems likely that we perceive the average difficulty of many tasks, which may mask the proportional relationship. There is a mathematical question here about the average difficulty of tasks and whether this means that the normal distribution better represents how we perceive difficulty. It seems possible, but I don't know how to justify it mathematically.
  3. Oops? Meaning maybe my example that lead me to the Laplace distribution as a motivating example is wrong. There is a simplifying assumption I made in that example that may not be quite right, and I'll have to work it through again to examine it carefully. There are a lot of things I didn't define very carefully that might come back to bite me here, but it's a blog, not a textbook, and I think my main points are essentially correct.

A closing thought: What does it mean to measure difficulty on a scale from negative to positive infinity? There probably are some tasks that are too easy to fail, or too difficult to ever succeed, yet on an infinite scale there is always some probability of each. This seems to border on a philosophical question, but if I work at it perhaps I can pin it down better than I have so far.

In Part 4, I have a game versus reality example to show you. Stay tuned!

Related:
The Endeavour: Sums of uniform random values
GBR Giant Battling Robots Favicon

12 October 2009

Games and Reality are Probably Different, Part 2

In Part 1 I tried to describe what I consider to be a basic difference between games and reality in the scale used to represent the difficulty of tasks. When you are playing a game and need to roll a certain target number or higher on the dice to succeed, this defines a scale of difficulty that is additive, and adding or subtracting 1 from the target number changes the probability of success in a certain way. I would argue that real world difficulty and probabilities for success are better represented on a proportional scale.
I have prepared some graphs to illustrate what I'm getting at. It's a bit of a difficult concept, and I find it hard to describe in simple terms. Hopefully this will help get my idea across.

Below is a graph of the probability density functions (PDF) for some common probability distributions, including several dice distributions (1), with two important changes: On the X-axis, the units here are not in the numbers you might roll on the dice, but instead in standard deviations as are used to describe the spread of the standard normal distribution (represented by Z). All the these have been "centered" so the most likely roll (or event) is at 0 (zero), and "scaled" so that the are spread out in an equal way. The other change is I have "inflated" the distributions by re-scaling the probability inversely proportional to the standard deviation of that distribution (2).  By standardizing these distributions onto the same X & Y scale, I hope it will make them easier to compare. You might want to consider popping the image out to another window for reference.


Working my way down the legend:

Uniform distribution - This represents random numbers between 0 and 1 (any range, actually) where every number is equally likely to occur. Thus, this line is perfectly flat across the graph. Compared to the other distributions, the most extreme events (easiest and hardest) are much more probable, but the scale of difficulty doesn't go out as far, limiting the range of smallest and largest probabilities.

1d10 - The dots on top of the uniform distribution represent the distribution of a 10-sided die. This a discrete uniform distribution with a range from 1 to 10. In fact, the distribution of probabilities for any single die roll will fall on this line, though the dots would of course be spread differently (any regular sided die, that is).

2d10 - this represents the distribution of the sum of two dice, and you might recognize the distinctive triangular shape from Kit's recent post about the Math of 2DX Systems. This random distribution is much more "central" than the uniform, but it also extends out to smaller probabilities.  Note this distribution is closer to the normal distribution than any other presented here.

2d6 - Due to the way I have standardized the distributions this has just the same shape as the 2d10 distribution. The sum of any two regular dice will look much the same.

(Standard) Normal distribution - This is here partly as a reference for comparison, because I have tweaked the other distributions to the same scale. It's also a useful reference because it shows up in many real world applications. This distribution can describe very extreme events, but the probabilities becomes very close to zero rapidly as you move away from the middle of the distribution.

Laplace distribution - This is the the mathematical relation I originally worked out for my shooting a target example in Part 1 to demonstrate proportional probabilities (the problem that started me thinking about all this in the first place). This distribution is very "central"; if you could have a die that rolled numbers with a Laplace distribution, most the the rolls would be fairly close to the average.Most, but not all, because the the remainder of the rolls would tend to be very high or very low. This distribution has "heavy tails", meaning that the probability of the most extreme events gets smaller very slowly as you move out from the middle (the tails are "heavier" than the normal distribution).

The next chart are the cumulative density functions (CDF) for the same distributions (3). By statistical convention I have created this so the probabilities accumulate from left to right, so if you think about this as trying to roll your dice higher than a target number, the higher number start on the left and go down to the right.
This manner of presenting distributions tends to squish everything together in the middle, but you can see that the heavy tails of the Laplace distribution really stand out from those of the normal.


So far I've shown these probabilities on a the usual scale from zero to one. However, to demonstrate the proportional relationship, it helps to present it on a logarithmic scale; just the thing for presenting proportional relationships. This requires converting from the usual 0-1 probability scale to an "odds scale" than ranges from 0 to infinity, and then taking the natural log. This really requires a separate description to fully explain this, which is the reason for my previous post on Probability versus Odds. Reading that first may be helpful.

Here is the previous chart again, except that now instead of probability, the Y-axis is the log-odds:


On the logarithmic scale proportional relationships appear as straight lines, and look what has happened here with the Laplace distribution; it is very nearly a straight line. Everything is crunched together in the middle, so I made a "zoom in" of the middle portion:


It looks as if this post is headed for Part 3, because it's getting late and I have to get up very early. I still need to discuss what I think this really means about the differences between games and reality, and this is a good place to break for comments. Stay tuned for Part 3.

Footnotes:
  1. For dice, which can only generate discrete numbers in a limited range, these are technically probability mass functions
  2. This is a weird thing to do, but I have re-scaled probability by dividing by the standard deviation. I could come up with distributions that looked like this in the first place, but they would be harder to compare directly. I really ought to redo that plot to labeled the Y-axis correctly.
  3. With one additional tinker: I shifted the discrete distributions so that a 0.50 probability lines up at Z=0 for all distributions.
GBR Giant Battling Robots Favicon

08 October 2009

Probability versus Odds

I keep referencing the odds and log-odds as ways to express probability, so it's worth the time to explain this concept by itself. In the future I can reference this post rather than re-explain the same idea every time.

Probabilities are numbers between zero and one [0,1]. This is sometimes also expressed as a percentage between 0% and 100%, but I percentages are sometimes used to represent proportions less-than zero or greater-than one, so I generally present probabilities as a number between zero and one to avoid that confusion (and it you ever teach intro-stats, it IS a confusion for some).

Odds are another way of expressing probability. For some event A that occurs with probability p, the "odds of A" are the ratio of (the probability of) A happening to A not-happening, so the odds of event A are p/(1-p). The odds transform a probability p between zero and one into a number that is between zero and positive infinity, and can represent any probabilities except for zero and one exactly. Fortunately, this isn't much of a limitation, because random events that never occur or always occur are not really random.

The odds are also often expressed as the ratio of two whole numbers. For example: if the probability of event A is p=0.6, then the odds of A are 0.6/(1-0.6) = 0.6/0.4 = 1.5. In whole numbers, 1.5 is equal to 3/2, and the odds are expressed as "3-to-2" odds, or sometimes just "3:2 odds". It's OK to skip the whole number step and just express the odds as "1.5-to-1" or "1.5:1" or just plain old "1.5". (Some people just don't like fractions I guess.)

Odds ratios are the ratio of two odds (I bet you didn't need me to tell you that). These might also be important, but not for today. Maybe I will come back and fill this in later.

Statistics are what I do to fund my gaming habit. Totally unrelated, I just thought I would throw this in for fun. :-)

Now, statisticians like to do regression models, and that usually means fitting a line equation to data that may range between negative and positive infinity. Numbers that are probabilities or odds present a problem because they have limited ranges, and regression models fit so nicely.
Enter the logarithmic transform, that funny little button on your calculator that most everyone learned about in school and promptly forgot about because they never use it. Logarithms transform numbers between zero and positive infinity to numbers between negative and positive infinity. They have some other nice properties too, like changing equations that are a series of multiplications into a series of sums, that are often easier to deal with mathematically.

Taking the logarithm of the odds turns this number into something statisticians know well. This facilitates regression models predicting the probability of an event occurring in much the same way as we might create any other regression model. Usually we use the natural log (log base e) for this, but the base doesn't matter too much. There are other functions that can also be used for this purpose (i.e.: Probit), but that is a tale for another day.

Back to the example: We started with a probability of p=0.6, which gave an odds of 1.5. The log-odds are then log(1.5)=0.4055. The charts below show the relationships between probability, odds, and log-odds.


This chart isn't very useful, because on a linear (our usual) scale the odds are relatively "flat", and then the explode to infinity as the probability of success approaches one.


Here is the same chart with the Y-axis changed to a logarithmic scale. Here is it easy to see what the odds are doing on the low end of the scale, and the symmetry of the relationship is clear.


Now the log-odds. Surprise! (well, maybe not.) This chart is identical to the last. All I have done is to switch the Y-axis back to our familiar linear scale, and substitute the natural log of the odds in place of the odds. Six of one, or a half-dozen of the other.

It is interesting to note that for probabilities between 0.25 and 0.75, the log-odds are nearly a straight line on this graph. In this range you can use a simple no-calculator conversion as a pretty good approximation between the two: log-odds = 4*(p-0.25) - 1, and p = 0.25 + (log-odds + 1)/4.
GBR Giant Battling Robots Favicon

07 October 2009

Games and Reality are Probably Different, Part 1

I've been thinking about how games represent reality. Realistic games are used to depict historical scenarios and as training for real strategy and tactics. They do it well enough that gamers get into discussions (even arguments) about how realistic a game is, and how the rules might be made better. The same applies to how games represent fantasy and fiction; A game about battling against dragons or Giant Battling Robots can represent that particular sort of fantasy very well, and players get into the same sort of discussion about how the game could be made more realistic (though in this case maybe I ought to say "more fantastic"). There is one aspect of games (boardgames, miniatures games, and RPG’s in particular) that I think is not realistic, and in all the various discussions of games I’ve been a part of no one has ever raised this complaint: Probability distributions generated by dice do not accurately represent the difficulty of real world tasks. (see footnote 1)

When you roll dice in a game to determine success or failure of an action, there is some predetermined probability of success. This probability is modified by various conditions; it might be range, terrain, type of weapon or armor, or any number of things. Each one of these things will add (or perhaps subtract) from the difficulty of the task. Add enough of these modifiers and the task becomes impossible (or impossible to fail). This is what I will refer to as “additive” probability, because difficulty modifiers add (or subtract) from the probability of success.

Now let’s consider a real world task; my example task will be shooting a weapon to hit a target of a fixed size. Suppose you are shooting a weapon (gun, bow and arrow, laser, PGMP-15, etc) at a target that has an area of 1 square meter. Hitting within that area is a success, and a miss is a failure. Also suppose the target is located at a distance D such that your probability of hitting within the 1 meter area is 50%. I’m assuming there is a bit of inherent randomness to the aiming process here that can be represented as a probability.

Now consider a second target of the same size but twice as far away. When we aim our weapon at this target, it’s apparent size is going to be 0.25 square meters, because it will appear half as tall and half as wide, and present ¼ the visible area of the closer target. At one quarter of the apparent size, it should be 4 times harder to hit the target (2,3). If we double the range again, we will get another proportional reduction in apparent target size, and a proportional increase in difficulty. The effect of increasing range has a proportional (or multiplying) effect on difficulty. We might find plenty of other example where adding difficulty has this proportional effect on the probability of success.

This is the difference I wanted to point out, that the real world often, and maybe always, has proportional probability instead of additive probability. Additive and proportional models of probability are two different ways of representing a probability that depends on other factors. (4)  So, how different are they, really? Does it make any difference? If it does make a difference, why don't we hear more about this? If it doesn't, why not?

A demonstration of these differences would be helpful, and I've made up some charts comparing different probability distributions. This is getting long, so I will save those for part 2, where I will also try to answer some of my own questions.

Footnotes:
(1) I’m intentionally being a bit contrary in this post to make a point. Please feel free to disagree with me.
(2) The exact form of the relationship depends on certain assumptions that I am not stating, but proportionality still holds.
(3) When I write “4 times harder” this means I am representing probability on a scale where this make sense (Odds). If you have a 50% chance of success, making this 4 times easier is nonsense (200% success?). If we represent 50% chance as 1:1 odds (read as “one-to-one odds”) of  success, it now makes sense to talk about 4:1 odds. For probability p, the corresponding odds = p/(1-p).
(4)  I use these proportional representations regularly in my work, and it is a standard statistical method (logistic regression, proportional odds and proportional hazards models).
(5) Bonus points if you figured out that the title of this post is a play-on-words. :-)
GBR Giant Battling Robots Favicon

06 October 2009

Dice Poll Results


The poll about my dice is now closed, and although the results are nothing spectacular, I'm still happy with them. Not a lot of people came here just because of the dice, but some did, and that is fine. It might have been more helpful to me if I'd put up the poll right after ORIGINS, and I'm guessing there are more people that simply missed the poll.

BR custom dice blog cardsOne thing that is pretty clear is that people like these dice, and it has been a successful promotion of my blog. It has also raised awareness among the Battletech community, which is an important part of my target audience.


I'm getting requests for more dice from people I know handing them out to other gaming groups, so I know the word is still getting around. This cost me $200, but it has done what it was supposed to do, and it been nice to have something I can give out that gamers appreciate. I would do it again, and my supply is running low, so I'll likely need more for next summer.

GBR Giant Battling Robots Favicon

05 October 2009

Farkle Probabilities

I've been playing Farkle on Facebook, so I started getting curious about the probabilities involved with the game. I'm not the only one doing this, as I've found several others doing much the same (1,2,3). You can also play Farkle at TADMAS. It took me a quite a bit of time tinkering with a spreadsheet until I understood how to think about this. I'm already up past my bedtime tonight, so I'm going to spare you the gory details and get right to the results. This post will focus on the number of dice you roll and the number of times you roll them. I haven't completely figured out the scoring distribution yet, so that may be a follow-up post.

The following table gives the probabilities for how many dice will remain after you remove all the dice which score points (but you might choose not to remove all). For instance, when you roll 6 dice, there is a 2.31% chance of not scoring at all, or a "Farkle" (marked in red), and 15.43% chance that you will be able to score exactly one die (a 1 or a 5). The percentages (marked in green) are the probabilities that all remaining dice can be scored, thus gaining a "new roll".


If you score one die and re-roll the remaining 5 dice, and there is (for example) a 30.86% chance that there will be 2 (three Sir) 3 dice left (and therefore the other two are 1's or 5's).
As you play, there is a choice to not score all of the dice. You might do this in hopes of getting a better throw on the next try, and you might use this table to consider the risk of choosing to re-roll 1's and 5's, instead of scoring them immediately.

That first table looked the the game from the "one roll at a time" perspective. The next table is a little more complicated because it "looks ahead" at what will happen if you score all the dice you can and keep rolling until you Farkle or get a new roll. Win/lose percentages marked in red and green are as before. Numbers in shaded gray are intermediate probabilities used in my calculations and have no simple interpretation.


These (red and green percentages) are conditional probabilities for what might happen. If you roll 6 dice, AND score one of those, AND roll the 5 remaining dice, there is a 1.19% chance of a Farkle.

My final table presents some some further conditional probability calculations, and gives the overall probabilities of either Farkle-ing or getting a new roll, if you score all possible dice and re-roll all that remain.


Starting with 6 dice, there is a 68.63% of Farkling before getting a new roll, assuming you choose not to "cash-in" your points first. If you want to think about the possibility of getting several re-rolls (thus scoring a large number of points), you can look at each group of 6 dice as a geometric series - a probability distribution which I have mentioned a few times before.

You can use these tables to inform yourself about the risk of Farkling as you play the game. This might help you understand the game, but by itself it probably won't help you achieve a high-score to beat all your friends. To do that will require an understanding of the relationship between the risk of losing your points versus the probability of achieving your target high-score. When I figure that out, I'll let you know.
[some revisions, 3/26/2011]
GBR Giant Battling Robots Favicon

01 October 2009

Know your Audience, and other Humor

Life has been busy, so here is some entertainment to fill the gap.


[Found on Probably Bad News]


[Found somewhere on Mental Floss, but I lost the page.]


[Zero Punctuation is always rude, crude, and highly entertaining.]


song chart memes
see more Funny Graphs
[From GraphJam]
GBR Giant Battling Robots Favicon