
There is an interesting post over at The Endeavor about using dice to approximate a Normal distribution. John Cook points out that determining the distribution of 5 dice by brute force would be a lot of work, and uses a generating function for the calculation of the exact distribution. John's blog is always a good read, and his mathematics elegant.
Not me though, I'm going to use brute force.
I once figured out a fairly simple way to calculate the probability distribution of the sum of any number of dice. That was at least 25 years ago though, and until John's post jogged my memory I forgotten all about it. The only problem, was that I didn't recall the trick. I've been playing with this off and on all day, but I finally rediscovered how this works.
 First some simple stuff. If I roll one dice (and it is fair) then I expect an equal probability of each face landing up, for a 1-in-6 chance each.

Summarizing the probabilities in a table, it looks like this.
 Now a little more complicated. Rolling two six-sided dice, there are 36 possible outcomes (36 = 6^2 = six squared). There is more than one way to roll every outcome except for 2 and 12, so we have to count them up carefully. The photo to the right shows all possible outcomes from 2 to 7. I ran out of dice before I could do 8 through 12, but I don't really need to because I know the distribution is symmetric. The chance of a 2 is the same as the chance of a 12, 3 the same as 11, likewise 4 and 10, 5 and 9, 6 and 8.
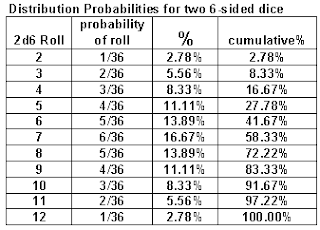
And the summary. Note the probabilities go up from 1-in-36 (@2) to 6-in-36 (@7) and back down again. Because this literally makes a triangle if I were to graph it, this is sometimes know as a "discrete triangular distribution".

Even my dice-maniac friends (except maybe Rick) don't have enough dice to demonstrate all the possibilities for three 6-sided dice, but here is a summary table for the probabilities of each roll. (And Rick, if you are reading this, that would require 648 dice.)

And now for the brute force. I set up a spreadsheet to tally up the frequencies (total number of combinations for each outcome).
Note there is some similarity here to Pascal's Triangle, especially if you rearrange this table a bit.

Rearranging the table was a good idea. The gray shaded cells turn out to correspond exactly to Pascal's Triangle, and I spent a lot of time trying to rediscover my "trick" on this basis. Each gray-shaded cell is the sum of the number in the cells immediately above and left (use zero if there is no neighbor above or left). This sum doesn't work for the rows below the first six though. Pascal's Triangle seems like a dead end, but I suspect there is some deeper relation I may have missed.

Below the first six rows, I noticed that the difference between the sum of the green-shaded cells and the yellow-shaded cell is always the value in the cell one-left and six up (red-shaded). That is: add the green, subtract the red, and it is equal to the yellow.

This is the trick I had forgotten, and it appears to work no matter how far I extend the table to sums of greater numbers of dice.
25 years ago I'm sure I never gave it such a test, and it's rather nice to know that I got it right way back then.
I have this in a spreadsheet, but it isn't pretty to look at, which is the down side of the brute force approach. This method could also be easily adjusted to calculate probabilities for sums of other-sided (4,8,10,12,20, etc) as well. Perhaps I will follow up on that.
Update: See Dice Distributions Revisited.
Not me though, I'm going to use brute force.
I once figured out a fairly simple way to calculate the probability distribution of the sum of any number of dice. That was at least 25 years ago though, and until John's post jogged my memory I forgotten all about it. The only problem, was that I didn't recall the trick. I've been playing with this off and on all day, but I finally rediscovered how this works.
 First some simple stuff. If I roll one dice (and it is fair) then I expect an equal probability of each face landing up, for a 1-in-6 chance each.
Summarizing the probabilities in a table, it looks like this.
 Now a little more complicated. Rolling two six-sided dice, there are 36 possible outcomes (36 = 6^2 = six squared). There is more than one way to roll every outcome except for 2 and 12, so we have to count them up carefully. The photo to the right shows all possible outcomes from 2 to 7. I ran out of dice before I could do 8 through 12, but I don't really need to because I know the distribution is symmetric. The chance of a 2 is the same as the chance of a 12, 3 the same as 11, likewise 4 and 10, 5 and 9, 6 and 8.
And the summary. Note the probabilities go up from 1-in-36 (@2) to 6-in-36 (@7) and back down again. Because this literally makes a triangle if I were to graph it, this is sometimes know as a "discrete triangular distribution".

Even my dice-maniac friends (except maybe Rick) don't have enough dice to demonstrate all the possibilities for three 6-sided dice, but here is a summary table for the probabilities of each roll. (And Rick, if you are reading this, that would require 648 dice.)

And now for the brute force. I set up a spreadsheet to tally up the frequencies (total number of combinations for each outcome).
Note there is some similarity here to Pascal's Triangle, especially if you rearrange this table a bit.

Rearranging the table was a good idea. The gray shaded cells turn out to correspond exactly to Pascal's Triangle, and I spent a lot of time trying to rediscover my "trick" on this basis. Each gray-shaded cell is the sum of the number in the cells immediately above and left (use zero if there is no neighbor above or left). This sum doesn't work for the rows below the first six though. Pascal's Triangle seems like a dead end, but I suspect there is some deeper relation I may have missed.

Below the first six rows, I noticed that the difference between the sum of the green-shaded cells and the yellow-shaded cell is always the value in the cell one-left and six up (red-shaded). That is: add the green, subtract the red, and it is equal to the yellow.

This is the trick I had forgotten, and it appears to work no matter how far I extend the table to sums of greater numbers of dice.
25 years ago I'm sure I never gave it such a test, and it's rather nice to know that I got it right way back then.
I have this in a spreadsheet, but it isn't pretty to look at, which is the down side of the brute force approach. This method could also be easily adjusted to calculate probabilities for sums of other-sided (4,8,10,12,20, etc) as well. Perhaps I will follow up on that.
Update: See Dice Distributions Revisited.
7 comments:
Well thank you ...
That reminds me, it's time to review my subscribers list again and post about it. Google tells me there are 150 of you out there now.
*sigh* It was just a flattery Spammer.
A suggestion for the relation to Pascal's triangle:
Check out the binomial distribution, and approximation of a normal distribution by a binomial distribution.
The binomial coefficients are exactly what appear in Pascal's triangle, and your dice experiment is closely related to those coefficients.
>The binomial coefficients are exactly what appear in Pascal's triangle, ...
Yes they are (See the gray shaded area in the tables above). My only trick is recognizing how it departs from Pascal's triangle due to the finite range of variation in a 6-sided die.
I suppose I could rewrite this more formally as a function, but other things are occupying my time at the present.
If you leave enough blank rows above your brute-force table, the value of each cell also equals the sum of the 6 cells above-and-to-the-left (example). ...I'm not sure what this tells me about Pascal's triangle, but at least it's easy to remember.
Yes, that is basically the method for generating Pascal's triangle. Pascal did it WAY before spreadsheets. :-)
Post a Comment